The daily work
Reading a lab report in
Photograph a report and its values go into the patient’s file — along with anything it could not read.
A patient brings last week’s CBC. Reading it and typing it in takes time, and next year nobody can find it. Photograph it instead and the values stay in the file, ready to be set beside the next one.
How it is done
- Open the patient’s file and start a new prescription.
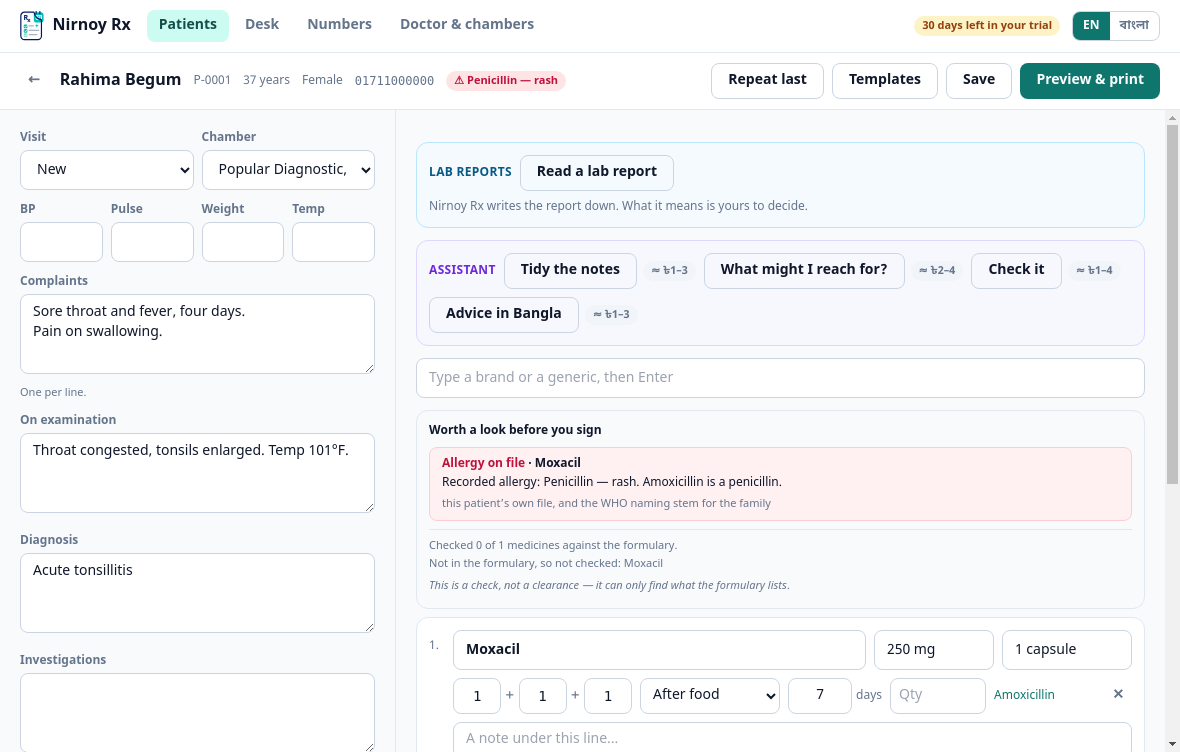
- In the Lab reports strip on the right, press Read a lab report.
- Photograph it, or choose a picture you already took. On a phone the camera opens directly.
- The button then says what reading it is likely to cost — usually two to five taka. Press it if you are happy.
- What it read appears as a table. Check it against the paper, then press Add to the file.
What it could not read
This is the part that matters most. Anything not plainly legible is named in its own amber panel and left out of the table. A tidy table with a row silently missing would give you no way to tell which figure was read and which was inferred — so check those rows against the paper yourself.
What it does not do
- It does not interpret. Only rows the report itself marked H or L show in red; it never decides for itself that a value is abnormal.
- It does not convert units. One laboratory’s mg/dL is never turned into another’s µmol/L — that would make the comparison untrue.
- It does not supply a reference range from memory. If the paper prints none, the column stays empty.
- It does not keep the picture, only the values. You have the paper, and photographs would make the file ten times the size within a year.
Outside the report’s own range
A row the laboratory marked H or L stays red. But laboratories are inconsistent about it: a low haemoglobin comes back with an L beside it, while an MCV of 71.4 against a printed range of 80–100 comes back with nothing at all. So anything falling outside the interval printed on the same page is marked separately. That is arithmetic — two numbers printed on one page, compared — and not a reading of the result.
How far outside is shown too. A figure more than half the width of the report’s own interval beyond the boundary sits in a red cell, because a whisker past the limit and a long way past it should not look the same on a screen. The yardstick is that same printed width. A one-sided range like “< 200” has no width, so such a figure is marked outside but never *well* outside — that claim would need a number the paper did not print.
Setting it beside the last one
Last time’s figure for the same test sits under the name, with its date. If the change is more than half the width of that report’s own reference interval, it is called out. The yardstick is the laboratory’s, not a threshold we invented — and where the units differ the earlier figure is shown but not compared.
Where the file holds more than one report of the same test, they are listed together, newest first. Names are matched as printed, ignoring case and a bracketed suffix: “Haemoglobin” and “Haemoglobin (Hb)” are one test. A bare “Hb” is not assumed to be the same — that is a clinical judgement, and the software does not make those.
If this page did not get you there, write to support — tell us where it stopped making sense and we will fix the page too.